We have algorithms for QQQ trading, one trade a month, which are based on return variance analysis of QQQ.
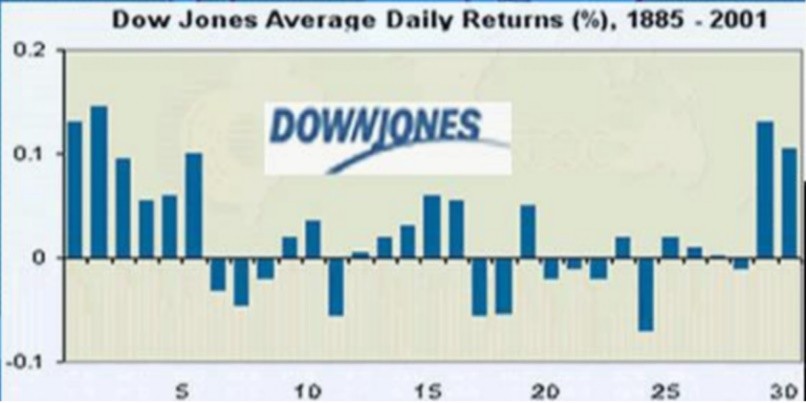
Previous studies on return variances were based on single period analysis. The return of the period under study is simply the close price minus the open price. Here is the one-period Return Variance Analysis of Dow.
We calculate the return of holding more than one period, to 2, 3, 4, 5, 6, 7, up to the maximum period of the longer time frame. For example, in a daily return variance of a calendar month, we calculate the return of holding for 1, 2, 3, 4, up to 21 days, since there are 21 trading days in a calendar month.
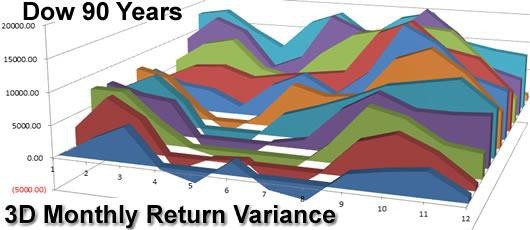
From the chart we can see, long Dow Jones index from May to September can not make money in the past 99 years. The strategy to long Dow Jones index can only generate profit from September to April. This further confirms the winter-summer effect on the 3D horizon.
Month-end Return Variance
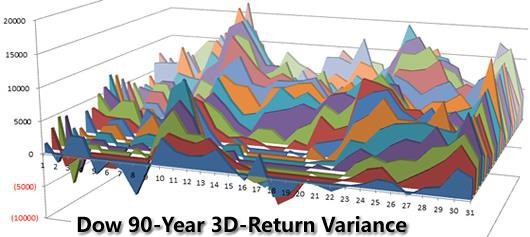
From the 3D chart we can see long Dow Jones index at the end of a month, and hold it for 10 days can generate substantial return in the past 90 years.
One-Trade-a-Month Model
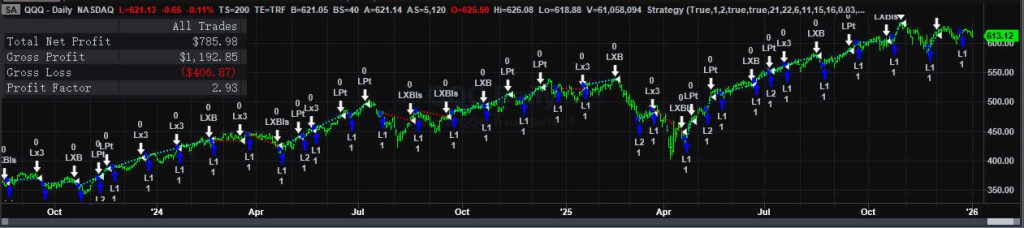
The long algorithm only goes long at a particular date of a month, and exits the long position after holding it for a fixed number of trading days. This simple strategy captures almost all upside movements of QQQ since its inception in 1999.
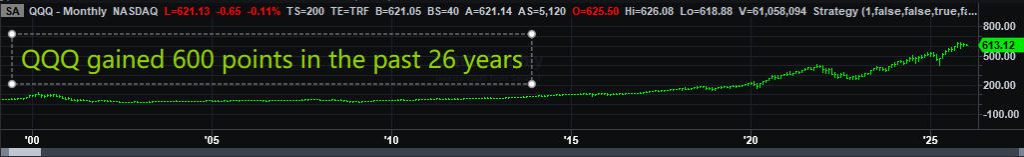
Our One-Trade-a-Month model generated 782 points, beating the market by 30%.
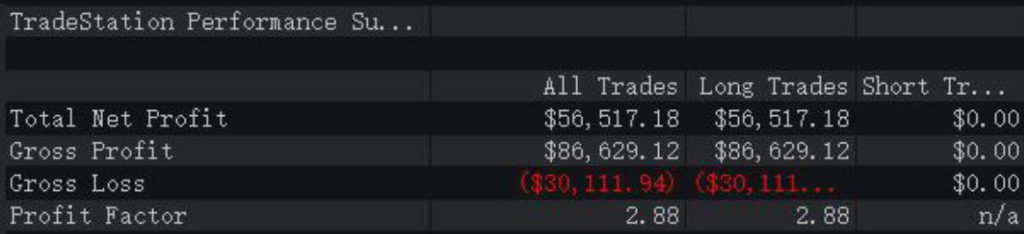
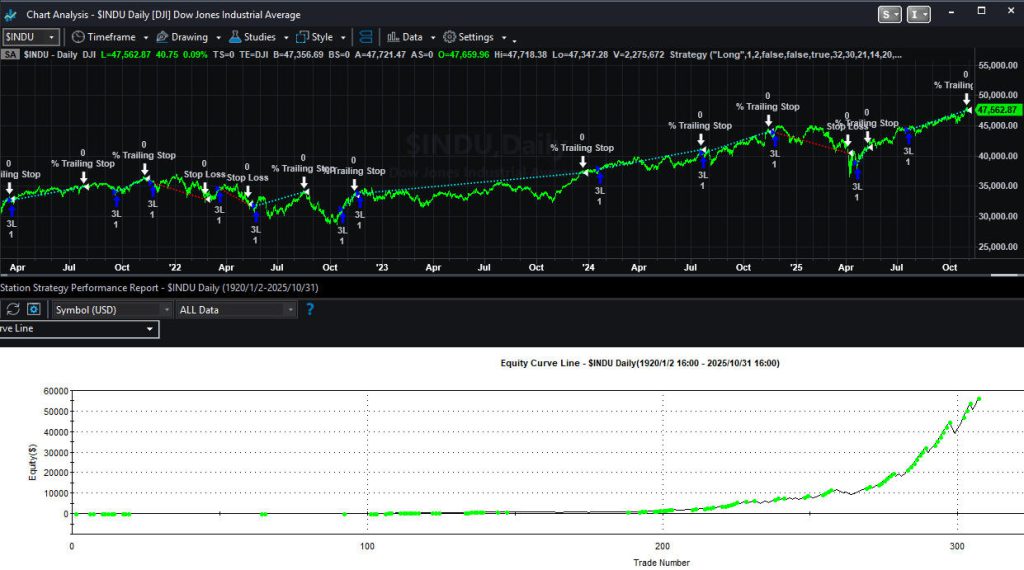
125 Years Back-Testing
We tested this One-Trade-a-Month model on 125 years of historical data of Dow. Here are the results. Dow gained 40,000 points in the past 125 years, our model realized 56,517 points beating the market by 40%.
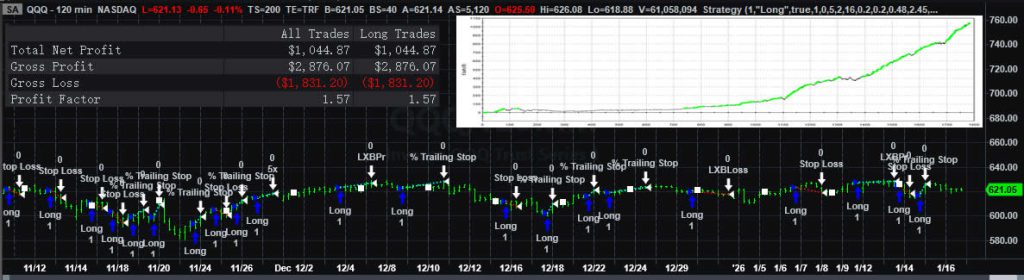
One-Trade-a-Week Model
This algorithm only goes long one trade a week, generating 1,044 points, out-performing the market by 74%. The model outperformed the One-Trade-a-Month model.
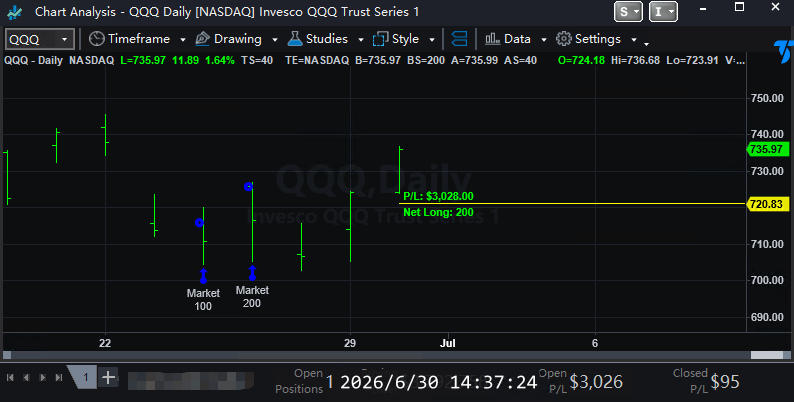
Live Trading Results
2026-6-30 QQQ